Selling event tickets
Wix Events: Understanding Wix Analytics Reports
In your Wix Events analytics reports you'll find insightful data about how guests RSVP to events, how your ticket orders change over time, and what your most popular events are. Use this information to identify trends, monitor sales, and improve future events.

In this article, learn more about:
How to access your Wix Events reports:
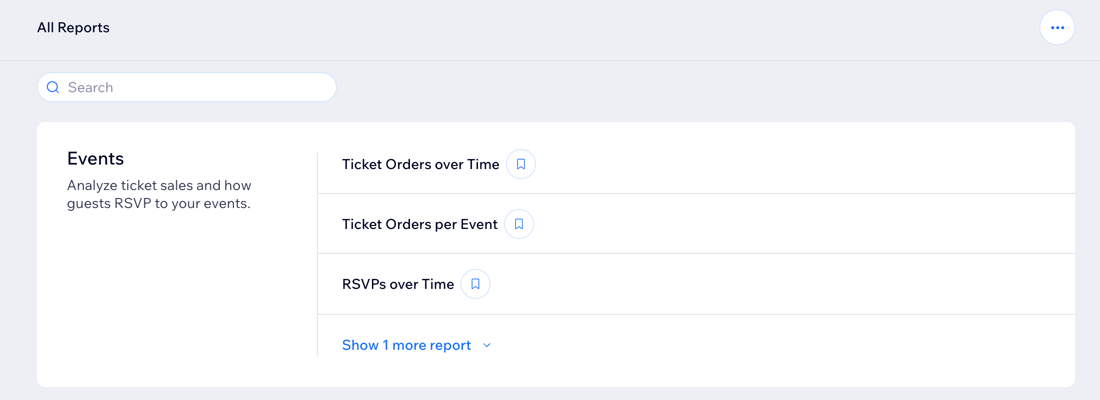
Go to All Reports in your site's dashboard and scroll down to the Events section.
Types of Wix Events reports
Understanding the different types of Wix Events reports helps you gain insights into your event performance and attendee behavior. These reports provide data on ticket orders, RSVPs, and check-in rates over specified time periods, and more.
Click a report type below to learn more about it:
Ticket Orders over Time
Your Ticket Orders over Time report explores your ticket order performance and trends. You can discover how the number of tickets ordered changed during specific time periods, and compare your data against previous months.
Use this report to:
See if adding new events or creating new marketing campaigns increases ticket orders.
Find out if clients prefer to order tickets on specific dates, or day of the week.
Ticket Orders per Event
Discover which events are your most popular. View your ticket orders by event, total orders, net sales and check-in rate for your guests customers.
Use this report to:
Monitor ticket orders.
See how your events ticket sales compare to previous periods.
RSVPs over Time
Your RSVPs over Time report shows your RSVP trends, which you can compare to previous periods.
Use this report to:
View trends in total RSVPs over different time periods.
Compare RSVP data across multiple events and time periods to identify patterns and trends.
RSVPs per Event
Your RSVPs per Event report displays responses to your events.
Use this report to:
Analyze the total number of guests and their RSVP statuses, including guests who RSVP'd yes, no, or are in a waitlist.
Track the number of guests who checked in and the overall checked-in rate.
FAQs
Click a question below to learn more about your Wix Analytics Events reports.
Where can I learn about the terminology used in these reports?
You can view definitions for Wix Events terms in the Wix Analytics glossary.
How do I save my favorite reports so that I can access them quickly?
On the All Reports page, click the Add to Saved reports icon  next to a specific report to add it to your saved reports. Your saved reports appear at the top of the page.

How do I change the type of graph in the report?
On the All Reports page, hover over a report to see the different views available. The graphs offered vary according to the type of report (e.g. tables, line charts, maps).

You could also switch between report views within a report by clicking the options at the top.

